> ## Documentation Index
> Fetch the complete documentation index at: https://ngquct-fix-failing-tests-on-main.mintlify.site/llms.txt
> Use this file to discover all available pages before exploring further.
# Query Results
> Choosing between results, pinning, the row cap, and what a failed or non-SELECT statement shows
Every statement you run gets its own result. The next run reuses an unpinned one rather than adding to the pile, so a result survives only as long as you leave it unpinned.
 ## Naming
A result is named after the table it came from. When there is no single table, the statement names itself, and a line comment written above the statement wins over the SQL:
```sql theme={null}
-- monthly totals
SELECT count(*) FROM orders;
```
names its result `monthly totals`. Names longer than 28 characters are truncated with an ellipsis, and a result no statement stands behind falls back to `Result 1`.
## Choosing a result
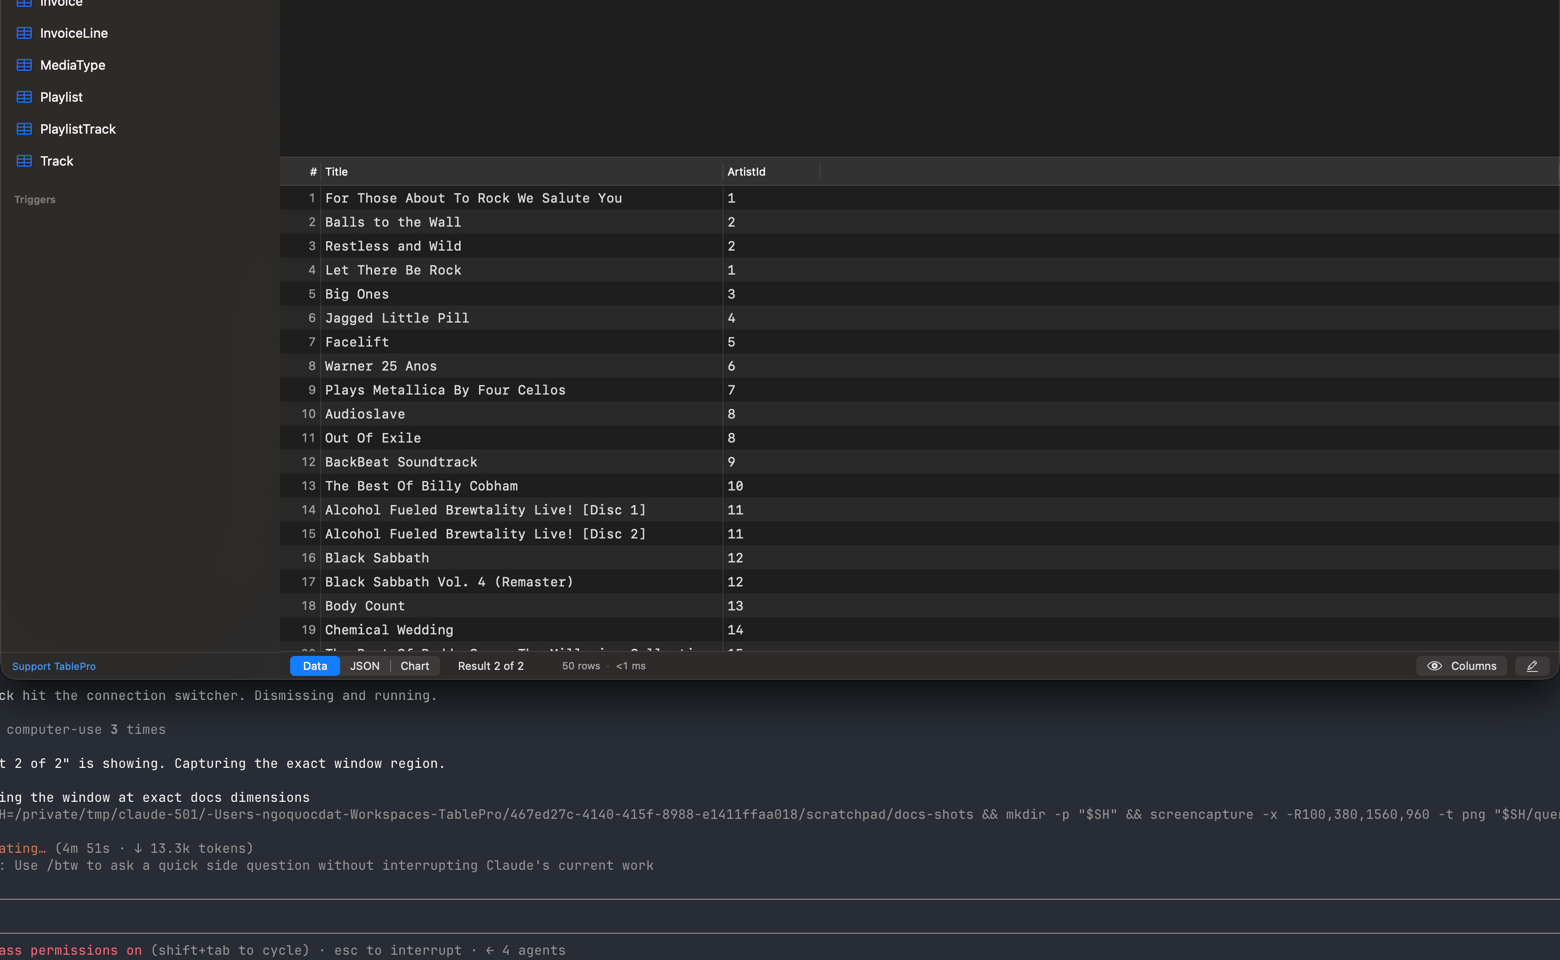
The chooser sits at the left of the bar under the grid and reads **Result 2 of 4**, or the result's own name when there is only one. A pin in front of the title means the result on screen is pinned.
| Action | How |
| ---------------------- | ------------------------------------------------------------------ |
| Switch result | `Cmd+Option+[` and `Cmd+Option+]`, or pick it from the chooser |
| Pin | Chooser > **Pin Result**, `Cmd+Option+P`, or **View > Pin Result** |
| Close | Chooser > **Close Result**, or `Cmd+Shift+W` |
| Close the rest | Chooser > **Close Other Results** |
| Show or hide the panel | `Cmd+Option+R`, or **View > Show Results** |
The next query opens a new result instead of overwriting a pinned one. Pinned results cannot be closed or cleared until you unpin them, which is what makes them useful for comparing two runs.
Picking a result moves the editor cursor to the statement that produced it and unfolds that statement if it was collapsed. Picking the result already showing does nothing, so clicking between pinned results never moves the editor under you. A statement you have since edited away leaves the cursor where it is.
The results panel expands itself when a query runs. **Query > Clear Results** empties it and leaves the query alone; **Query > Clear Query** empties the editor and leaves the results. Both are also on the **Run** button's menu.
## How long it took
The bar under the grid reads the elapsed time of the last query, from sending it to having the last row. On a remote server, or through an [SSH tunnel](/connections/ssh-profiles), most of a large result's elapsed time is transfer rather than the query.
Click the number for the split.
| Row | What it measures |
| --------- | ----------------------------------------------------------------------------- |
| Elapsed | Sending the query to having the last row |
| Server | Execution time the engine reported for itself, with no network in it |
| First row | Sending the query to the first row arriving, including one network round trip |
| Transfer | The rest of the elapsed time, spent moving rows |
A long **Transfer** behind a quick **Server** or **First row** is a slow link or a wide result, not a slow query.
MySQL, MariaDB, PostgreSQL, CockroachDB, Redshift, ClickHouse and BigQuery report **First row**. BigQuery adds **Server** from its job statistics, and ClickHouse adds it on a query that returns no rows, where the summary arrives as a header the client sees. Every other engine shows the elapsed time on its own, and the number does not open.
## The row cap
A query that returns rows and carries no `LIMIT`, `FETCH FIRST` or `TOP` of its own stops at the row cap: `SELECT`, `WITH`, `TABLE`, `VALUES`, and a set operation whose arms are parenthesised.
Your SQL reaches the server exactly as you wrote it. The cap applies to the rows read back, so a
query carrying its own `LIMIT`, `FETCH FIRST` or `TOP` is never touched, and `EXPLAIN`, `SHOW`,
writes and DDL are never capped. The read itself stops at the cap on MySQL, MariaDB, PostgreSQL,
CockroachDB, Redshift, SQLite, MSSQL, Oracle, Cassandra, Redis, DynamoDB, BigQuery, Snowflake, Trino,
ClickHouse and MongoDB, so the rest of the result never crosses the network. Cloudflare D1, LibSQL,
Etcd, DuckDB, Elasticsearch, Typesense, SurrealDB, Beancount and Dameng still read the whole result and keep the
first rows. A plan that has to finish before it can return a first row, a sort with no index or a
`GROUP BY`, runs to completion on the server either way. Both numbers are in **Settings > Data**
([Data settings](/customization/data-settings)).
When the cap trims a result the status bar reads **Showing N rows** and offers **Fetch All**, which extends the result in place. To skip the cap for one run, press `Cmd+Option+Enter` or choose **Run Without Limit** from the **Run** button's menu.
## Statements that return no rows
INSERT, UPDATE, DELETE and DDL show a success view with the affected row count and the execution time.
## Server output
Lines a statement prints on the server show with that statement's result. On Oracle that is `DBMS_OUTPUT.PUT_LINE`, and the output is on from the moment you connect: no `SET SERVEROUTPUT ON`.
* A block or procedure call that returns no rows shows its lines under the success message.
* A query that returned rows and also printed gains an **Output** mode beside **Data**.
* A statement that fails lists the first 20 lines it printed before the error, inside the error banner.
The lines are read after every statement run from the editor, so each result holds only what its own statement printed. At most 10,000 lines are kept per statement; past that the result reads "The output was cut short." and the rest is discarded. Lines a trigger prints while a grid edit is saved are not read then, and show with the next statement you run from the editor.
## Failed statements
A failed statement shows a red banner above the results with the database's own error message and a **Fix with AI** button. See [AI Assistant](/features/ai-assistant). A control character or zero-width space in the message shows as its short name in angle brackets, such as ``; see [Invisible characters](/features/sql-editor#invisible-characters).
## Naming
A result is named after the table it came from. When there is no single table, the statement names itself, and a line comment written above the statement wins over the SQL:
```sql theme={null}
-- monthly totals
SELECT count(*) FROM orders;
```
names its result `monthly totals`. Names longer than 28 characters are truncated with an ellipsis, and a result no statement stands behind falls back to `Result 1`.
## Choosing a result
The chooser sits at the left of the bar under the grid and reads **Result 2 of 4**, or the result's own name when there is only one. A pin in front of the title means the result on screen is pinned.
| Action | How |
| ---------------------- | ------------------------------------------------------------------ |
| Switch result | `Cmd+Option+[` and `Cmd+Option+]`, or pick it from the chooser |
| Pin | Chooser > **Pin Result**, `Cmd+Option+P`, or **View > Pin Result** |
| Close | Chooser > **Close Result**, or `Cmd+Shift+W` |
| Close the rest | Chooser > **Close Other Results** |
| Show or hide the panel | `Cmd+Option+R`, or **View > Show Results** |
The next query opens a new result instead of overwriting a pinned one. Pinned results cannot be closed or cleared until you unpin them, which is what makes them useful for comparing two runs.
Picking a result moves the editor cursor to the statement that produced it and unfolds that statement if it was collapsed. Picking the result already showing does nothing, so clicking between pinned results never moves the editor under you. A statement you have since edited away leaves the cursor where it is.
The results panel expands itself when a query runs. **Query > Clear Results** empties it and leaves the query alone; **Query > Clear Query** empties the editor and leaves the results. Both are also on the **Run** button's menu.
## How long it took
The bar under the grid reads the elapsed time of the last query, from sending it to having the last row. On a remote server, or through an [SSH tunnel](/connections/ssh-profiles), most of a large result's elapsed time is transfer rather than the query.
Click the number for the split.
| Row | What it measures |
| --------- | ----------------------------------------------------------------------------- |
| Elapsed | Sending the query to having the last row |
| Server | Execution time the engine reported for itself, with no network in it |
| First row | Sending the query to the first row arriving, including one network round trip |
| Transfer | The rest of the elapsed time, spent moving rows |
A long **Transfer** behind a quick **Server** or **First row** is a slow link or a wide result, not a slow query.
MySQL, MariaDB, PostgreSQL, CockroachDB, Redshift, ClickHouse and BigQuery report **First row**. BigQuery adds **Server** from its job statistics, and ClickHouse adds it on a query that returns no rows, where the summary arrives as a header the client sees. Every other engine shows the elapsed time on its own, and the number does not open.
## The row cap
A query that returns rows and carries no `LIMIT`, `FETCH FIRST` or `TOP` of its own stops at the row cap: `SELECT`, `WITH`, `TABLE`, `VALUES`, and a set operation whose arms are parenthesised.
Your SQL reaches the server exactly as you wrote it. The cap applies to the rows read back, so a
query carrying its own `LIMIT`, `FETCH FIRST` or `TOP` is never touched, and `EXPLAIN`, `SHOW`,
writes and DDL are never capped. The read itself stops at the cap on MySQL, MariaDB, PostgreSQL,
CockroachDB, Redshift, SQLite, MSSQL, Oracle, Cassandra, Redis, DynamoDB, BigQuery, Snowflake, Trino,
ClickHouse and MongoDB, so the rest of the result never crosses the network. Cloudflare D1, LibSQL,
Etcd, DuckDB, Elasticsearch, Typesense, SurrealDB, Beancount and Dameng still read the whole result and keep the
first rows. A plan that has to finish before it can return a first row, a sort with no index or a
`GROUP BY`, runs to completion on the server either way. Both numbers are in **Settings > Data**
([Data settings](/customization/data-settings)).
When the cap trims a result the status bar reads **Showing N rows** and offers **Fetch All**, which extends the result in place. To skip the cap for one run, press `Cmd+Option+Enter` or choose **Run Without Limit** from the **Run** button's menu.
## Statements that return no rows
INSERT, UPDATE, DELETE and DDL show a success view with the affected row count and the execution time.
## Server output
Lines a statement prints on the server show with that statement's result. On Oracle that is `DBMS_OUTPUT.PUT_LINE`, and the output is on from the moment you connect: no `SET SERVEROUTPUT ON`.
* A block or procedure call that returns no rows shows its lines under the success message.
* A query that returned rows and also printed gains an **Output** mode beside **Data**.
* A statement that fails lists the first 20 lines it printed before the error, inside the error banner.
The lines are read after every statement run from the editor, so each result holds only what its own statement printed. At most 10,000 lines are kept per statement; past that the result reads "The output was cut short." and the rest is discarded. Lines a trigger prints while a grid edit is saved are not read then, and show with the next statement you run from the editor.
## Failed statements
A failed statement shows a red banner above the results with the database's own error message and a **Fix with AI** button. See [AI Assistant](/features/ai-assistant). A control character or zero-width space in the message shows as its short name in angle brackets, such as ``; see [Invisible characters](/features/sql-editor#invisible-characters).